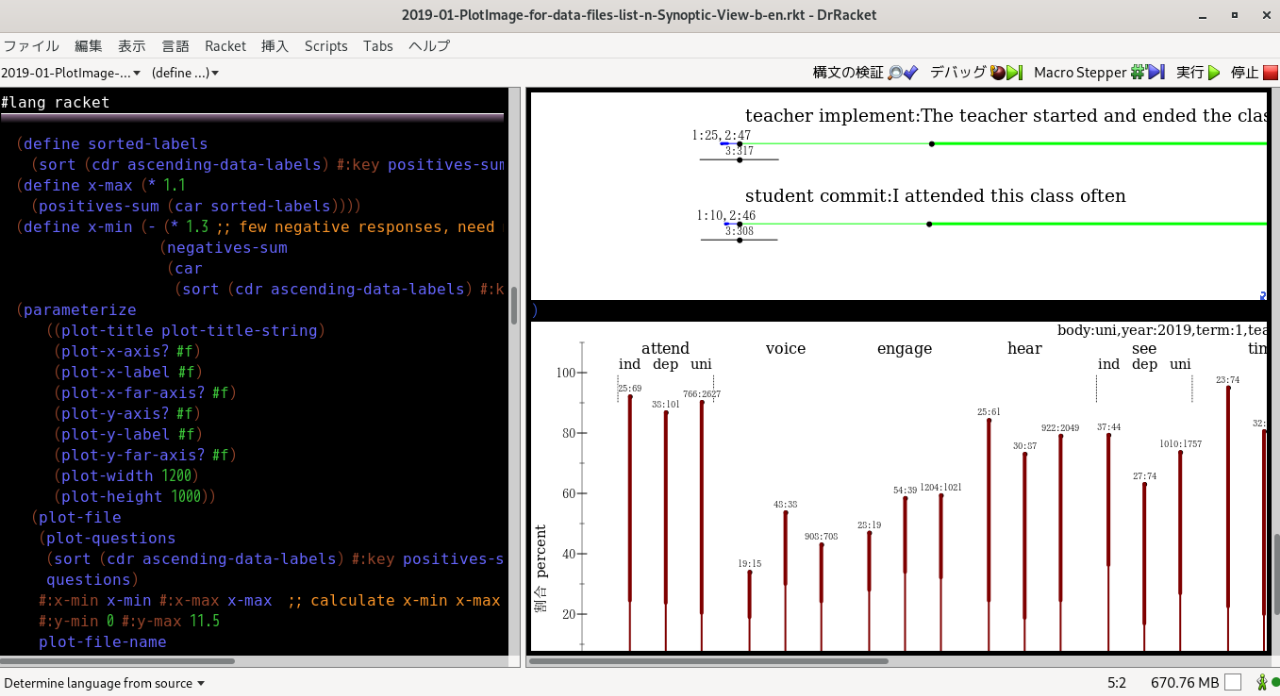
FD Racket
Eariler code had a bug in plot-a-body
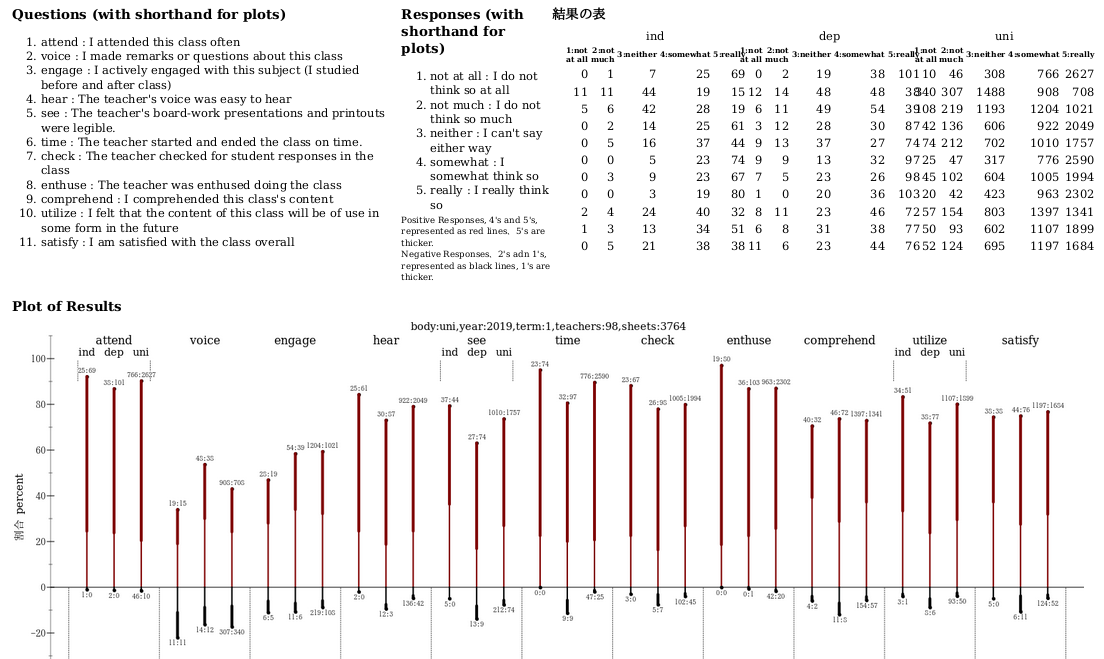
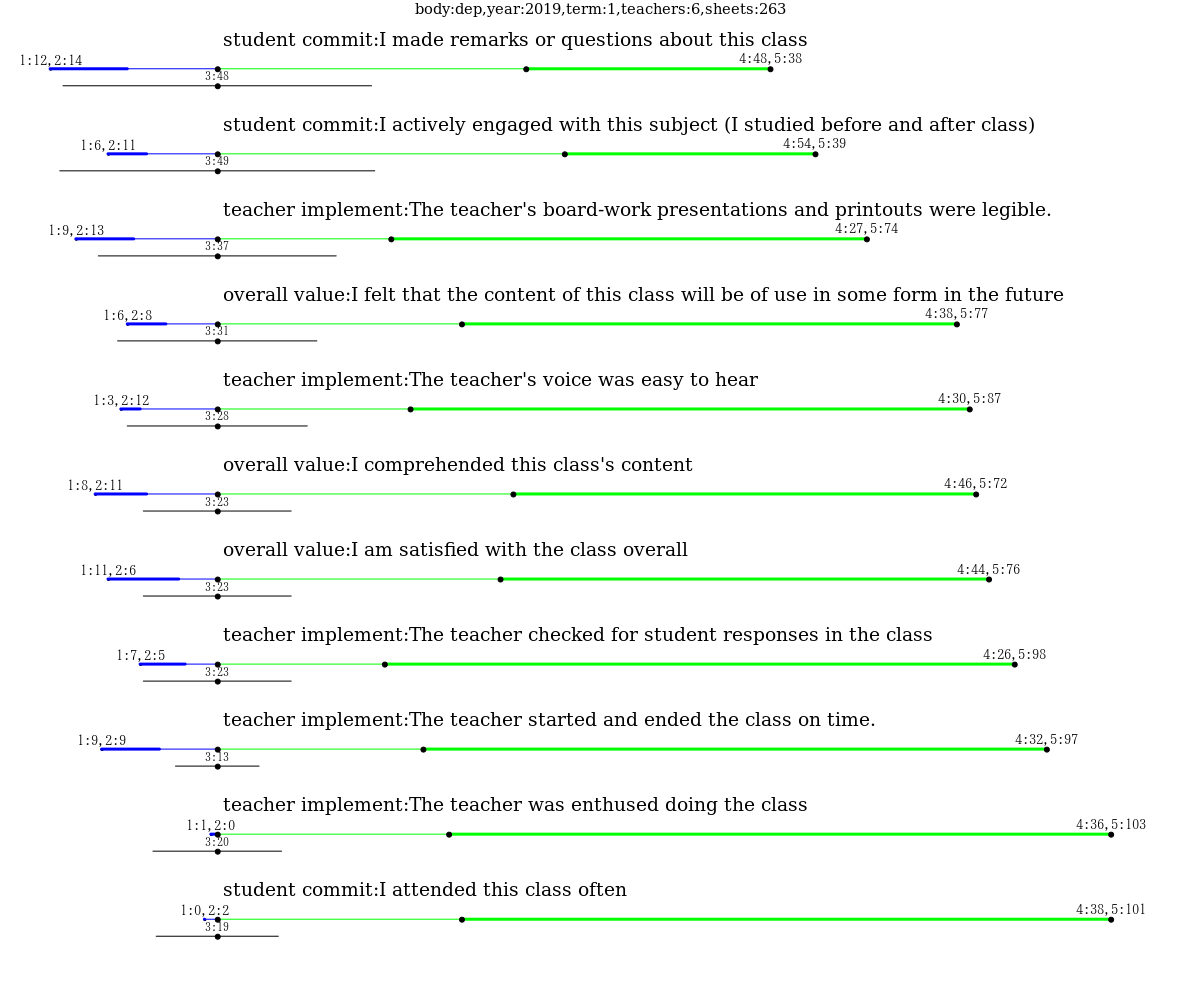
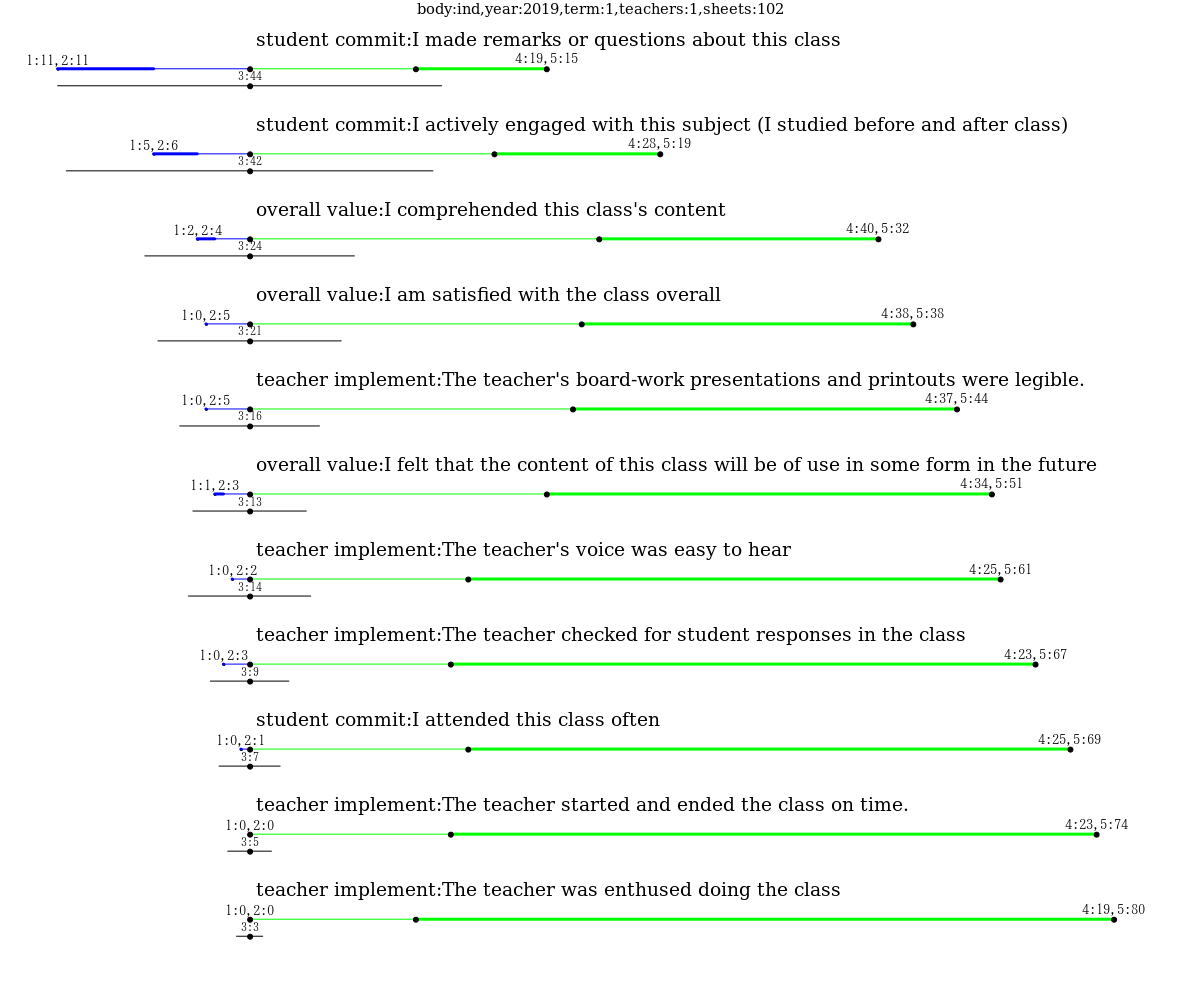
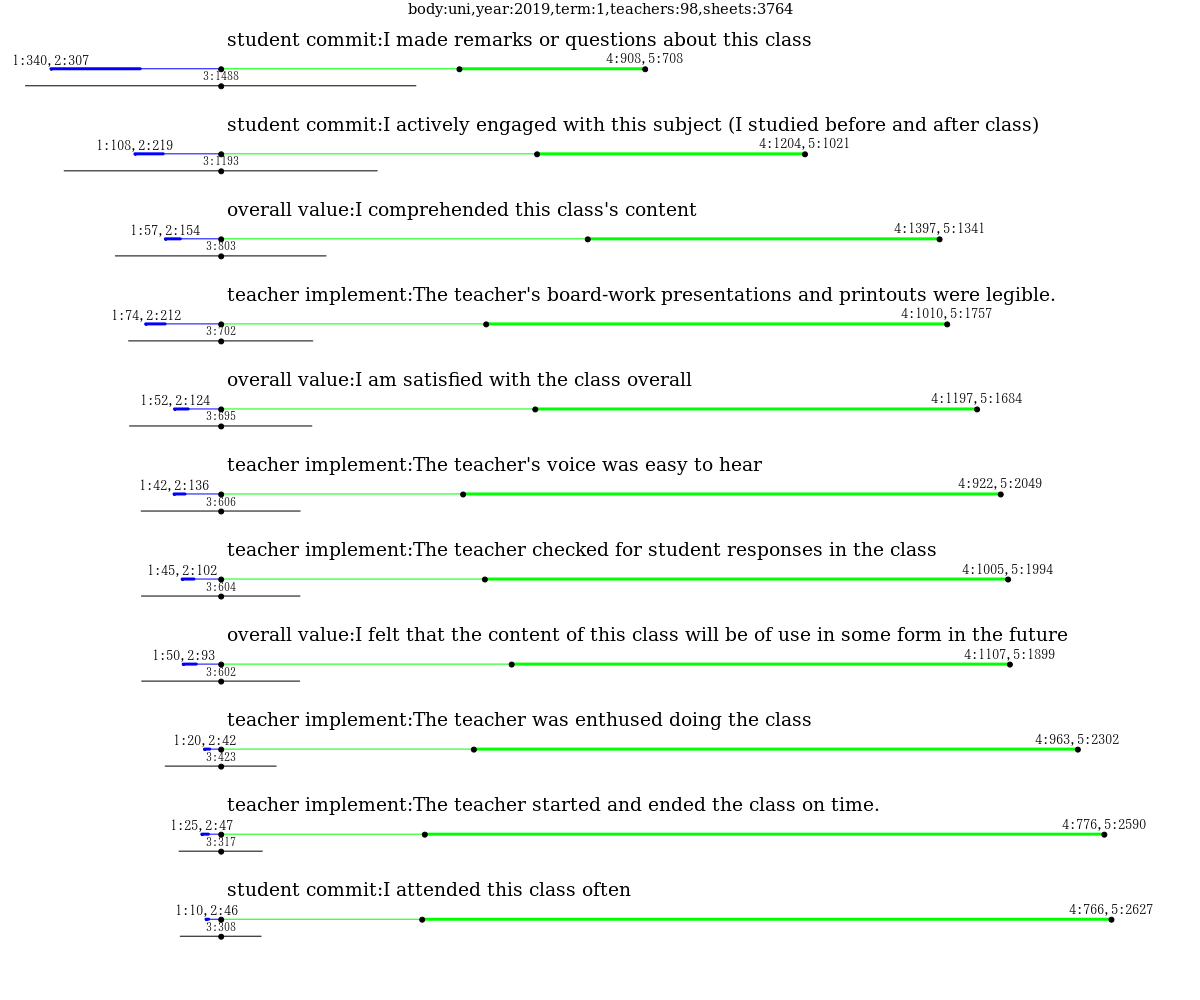
where the y-max was hard-coded to 10.5 in spite of their being 11 questions. So the question with the lowest number of positive responses, the questions most in need of attention, that question was not plotted. The embarrassing bug got me to finally the y-max value to the length of the data-strings lists supplied to plot-a-body
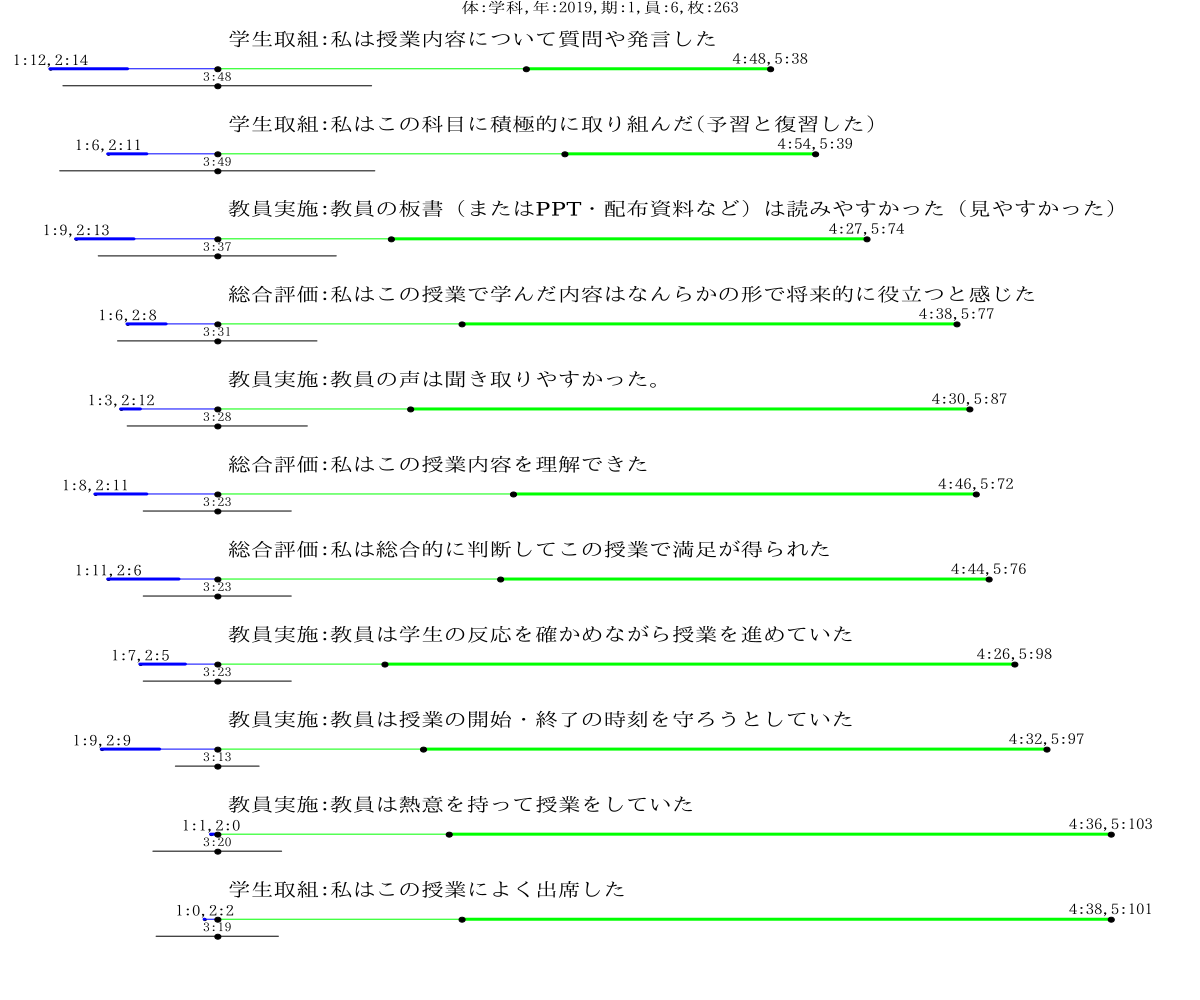
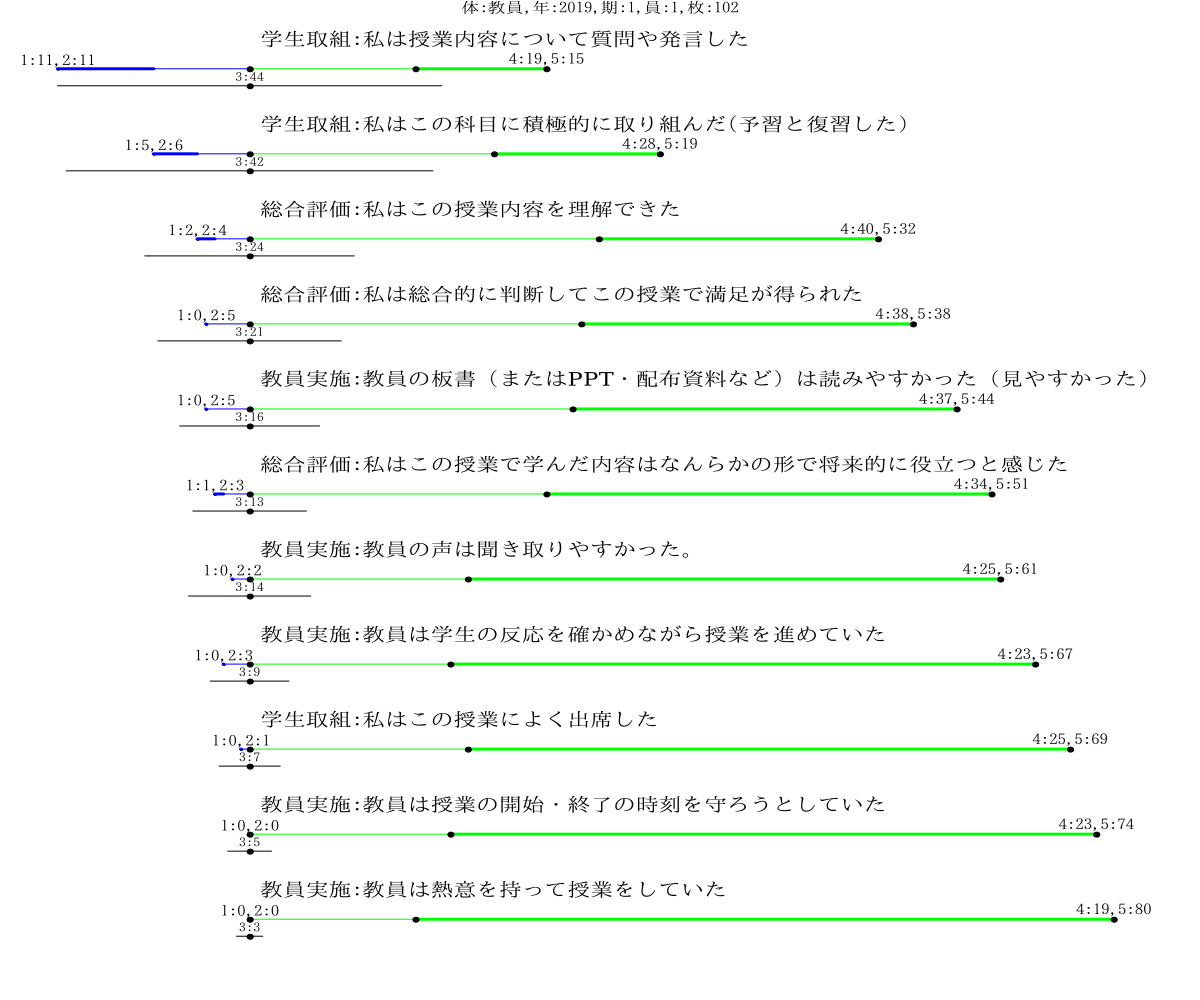
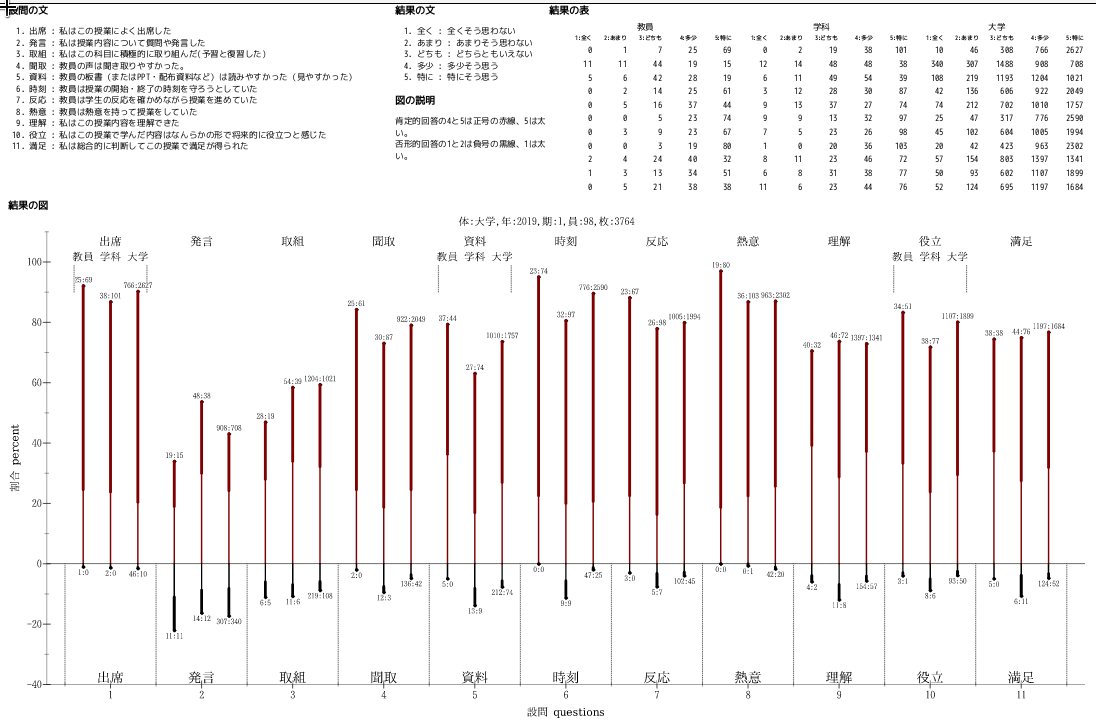
Faculty Development classroom questionnaires: visualizing .csv data
DG.csv
体,年,期,員,枚
大学,2019,2,58,2049
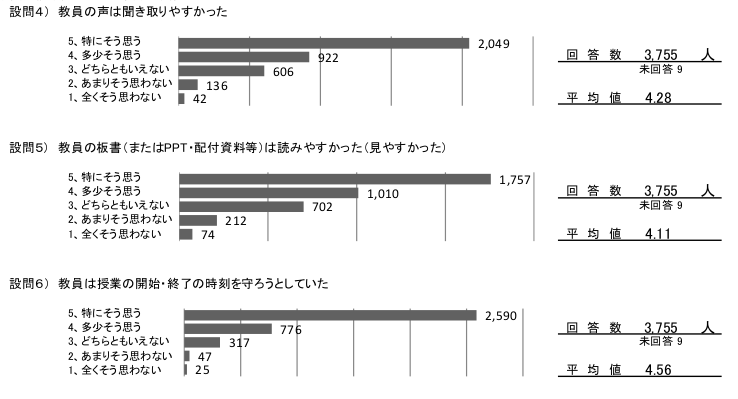
設問,5,4,3,2,1
出席,1494,469,211,37,4
発言,396,534,926,197,162
取組,648,773,662,103,28
聞取,1277,579,285,62,11
資料,1123,636,366,68,18
時刻,1615,415,162,15,4
反応,1288,574,300,41,10
熱意,1512,469,210,15,6
理解,858,897,405,40,15
役立,1276,658,243,27,11
満足,1101,743,328,29,12
utils.rkt
#lang racket
;open file in DrRacket
(require csv-reading); for csv->list
(require plot)
(require plot/utils)
(require racket/dict)
(require racket/include)
(include "utils.rkt")
(match-define (list positive-color neutral-color negative-color)
(list "red" "gray" "black"))
(define plot-img-ext "png")
(define page-ext "html")
(define Qs-file "SetsuMon.csv") ;; Qs-ja-file, Qs-en-file
(define Rs-file "KaiTou.csv") ;; Responses-ja.csv Response-en.csv
(define Qs (get-file-csv-data Qs-file))
;; 11 lists like this: '("出席" "学生取組" "私はこの授業によく出席した")
(define Rs (get-file-csv-data Rs-file))
;; 5 lists like this: '("5" "特に" "特にそう思う")
(define Qs-num-short (for/list ((Q Qs) ;; self-documenting?
(N (in-naturals)))
(cons (add1 N) (list (car Q)))))
;; ;;
;; (define data-files '("KI.csv" "GK.csv" "DG.csv"))
(match-define (list KI-info KI-data)
(csv-data-to-classdict-Qdata "KI.csv"))
;; test: KI-data
(match-define (list GK-info GK-data)
(csv-data-to-classdict-Qdata "GK.csv"))
(match-define (list DG-info DG-data)
(csv-data-to-classdict-Qdata "DG.csv"))
;; test expln: KI.csv with trailing commas DG-info without trailing ,
;; test: KI-info DG-info
(define (minus-part-numbers-from-whole part-data whole-data)
(for/list ((p-row part-data)
(w-row whole-data))
(map - (get-Qline-result-numbers w-row)
(get-Qline-result-numbers p-row))))
;; test: (minus-part-numbers-from-whole KI-data GK-data)
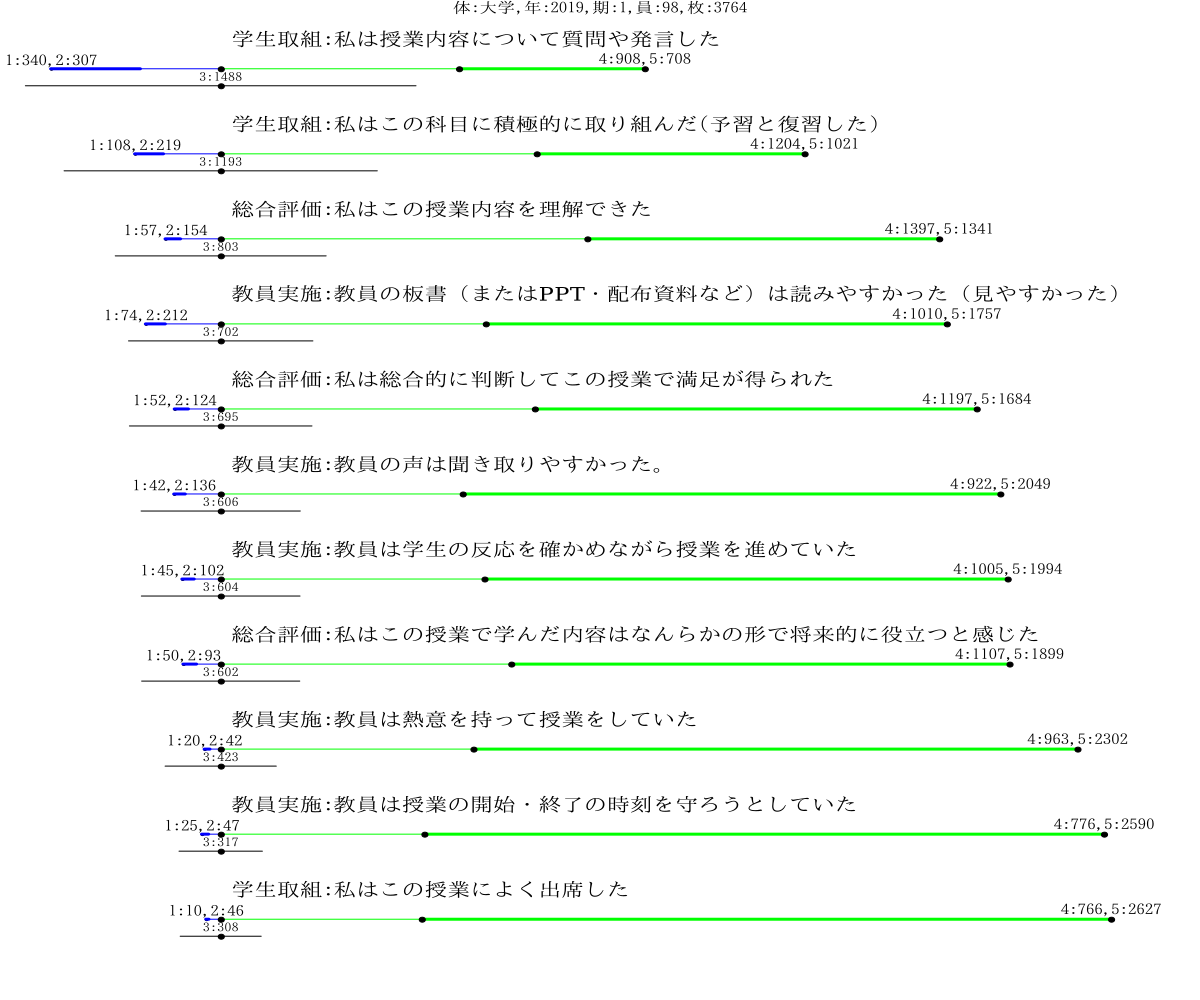
(plot-a-body KI-info KI-data)
(plot-a-body GK-info GK-data)
(plot-a-body DG-info DG-data)
;;;;;;;;;;;;;;;;;;;;;;;;;;;;;;;;;;;;;; end one-body view
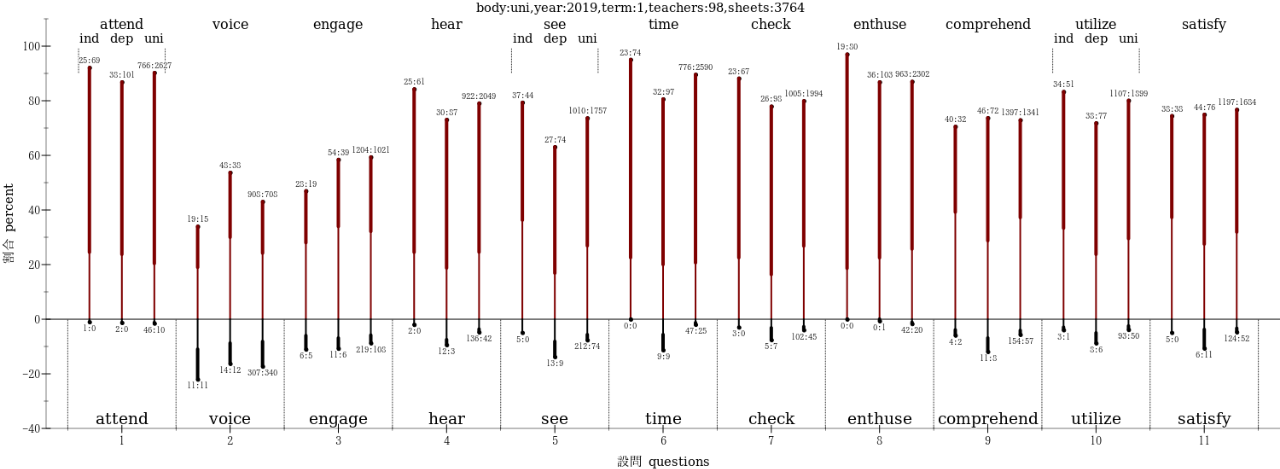
;;;;;;;;;;;;;;;;;;;;;;;;;;;;;;;;;;;;;; start synoptic view
;;; make 3body view, for one body previous semester,
;;; ;; previous year same semester, gradually generalize for
;;; ;; adjusting size according to number of comparisons
;; (info-to-file-name KI-info plot-img-ext "synoptic")
(match-define (list KI-results GK-results DG-results)
(map cdr (list KI-data GK-data DG-data)))
;; (data-strings-row-to-numbers (second KI-data))
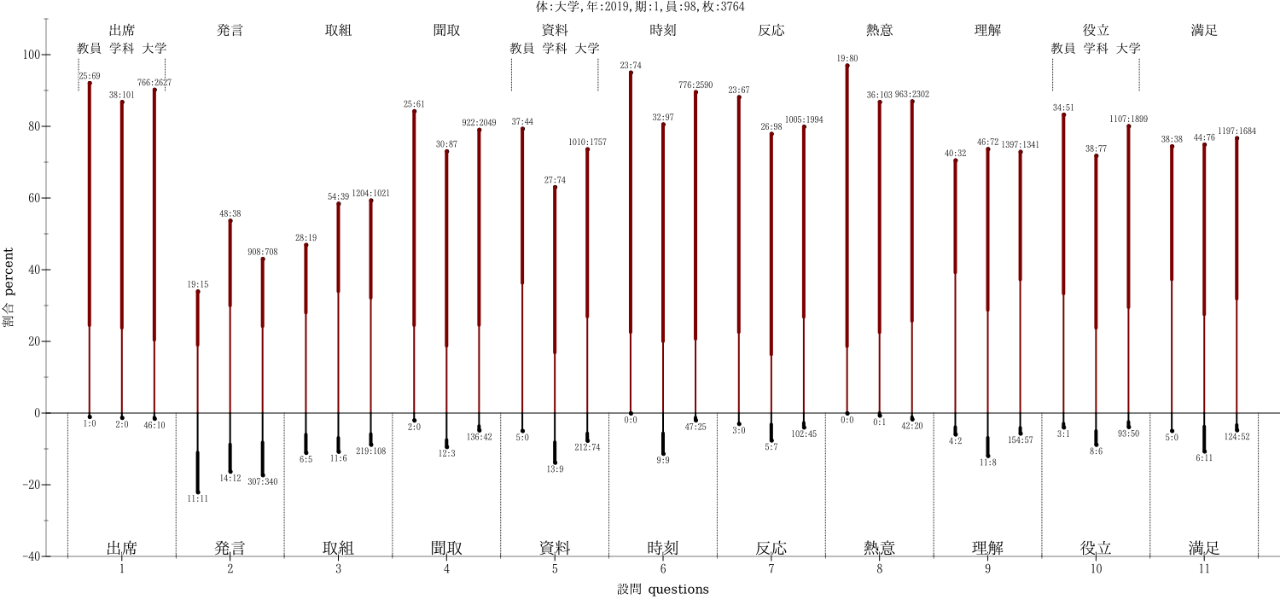
(parameterize
((plot-x-ticks (linear-ticks #:number 11))
(plot-y-ticks (linear-ticks #:number 8))
(plot-x-far-axis? #f)
(plot-y-far-axis? #f))
(plot
(list
(label-3-row-lines 2 85 55 110); Qnum label-y dot-low dot-high
(map label-3-row-lines '(5 7 9 11)) ;; notate a few Q-lines
(label-mark-bottom-x-axis Qs-num-short)
(label-top-x-axis-with-Q-shorts Qs-num-short)
(stack-sides-interweave-3-data-sets KI-results GK-results DG-results)
)
#:x-label "設問 questions" #:y-label "割合 percent"
#:x-min .3 #:x-max 11.7
#:y-min -40 #:y-max 110
#:width 1500 #:height 600
#:title (info-to-plot-title DG-info)
#:out-file (info-to-file-name DG-info plot-img-ext "synoptic")
#:out-kind (img-type-prep plot-img-ext)
))
See Question Results in DrRacekt, as img files
(define (get-file-csv-data file-name)
  (define f-port (open-input-file file-name))
  (define data-lists (csv->list f-port))
  (close-input-port f-port)
  ;; close-* can't be last line or proc returns void
  data-lists)

(define (transpose-table lists)
  (define (recur ls merged)
    (cond
     ((empty? (car ls)) (reverse merged))
     (else (recur (map cdr ls)
		  (cons (map car ls) merged)))))
  (recur lists '()))

(define (remove-empty-cells dict)
  (filter (λ (cell) (< 0 (string-length (car cell))))
	  dict))
(define (csv-data-to-classdict-Qdata f-name)
  (define data-list (get-file-csv-data f-name))
  (define classdict (remove-empty-cells
		     (transpose-table
		      (take data-list 2))))
  (define Qdata (drop data-list 2))
  (list classdict  Qdata))
;; test: (define KId (csv-data-to-classdict-Qdata "KI.csv")) KId@


;; -data is all strings, good for labels in plot
;; ; but calculations need string->number conversions
(define (get-Qline-result-numbers Qline)
  (map string->number (cdr Qline)))
(define (get-Qdata-result-numbers data)
  ;; first data line is list of headers
  (define Q-results (cdr data))
    (for/list ((Qline Q-results))
      ;; first cell of each result list is short-name for Q
      ;; ; skip short name and string->number each frequency
      (get-Qline-result-numbers Qline)))
;; test: (get-numbers KI-data)

(define (info-to-plot-title dict)
  (string-join
   (for/list ((cell dict))
     (string-join cell ":"))
     ","))
;; test: (info-to-plot-title DG-info)

(define (info-to-page-title info (prefix ""))
  (if (< 0 (string-length prefix))
     (string-append prefix "-"
                   (string-join (map second
                                    (cdr info))))
     (string-join (map second info) "-")))
;; test: (info-to-page-title DG-info)
;; test: (info-to-page-title DG-info "共観")

(define (img-type-prep ext)
  (define sym
    (cond
     ((symbol? ext) ext)
     ((string? ext) (string->symbol
		     (regexp-replace #rx"^\\." ext "")))
     (else error "ext needs to be a string or a symbol")))
  sym)

(define (file-ext-string-check str)
  (if (regexp-match? #rx"^\\." str)
                  str
                  (string-append "." str)))
(define (file-ext-prep ext)
  (cond
    ((symbol? ext) (file-ext-string-check
                    (symbol->string ext)))
    ((string? ext) (file-ext-string-check
                    ext))
    (else (error "file extension must be a symbol or string"))))
;; test: (file-ext-prep plot-img-ext)
(define (file-add-extension fname ext)
  (string-append fname (file-ext-prep ext)))
;; test: (file-add-extension "file" plot-img-ext)
;; > (file-add-extension "file" 'svg) "file.svg"
;; > (file-add-extension "file" "png") "file.png"
;; > (file-add-extension "file" ".png")

(define (info-to-one-body-plot-file-name dict (ext plot-img-ext))
  (file-add-extension
   (string-join (map second dict) "-") ext))
;; test: (info-to-one-body-plot-file-name DG-info)

(define (Qresults-to-ascending-order Qresults)
  ;; header row removed from data for Qresults arg
  (map (λ (row) (cons (car row) (reverse (cdr row))))
       Qresults))

(define (get-result-number row n)
  (string->number (list-ref row n)))

;; later (sum-results row list-of-numbers...
(define (sum-2-results row n m)
  (+ (get-result-number row n) (get-result-number row m)))

;; depends on ascending order or results after Q-short-name
(define (positives-sum row)
  (sum-2-results row 4 5))
(define (negatives-sum row)
  (sum-2-results row 1 2))

(define (get-neutral-response-num row)
  (list-ref row 3))

(define (neutral-line row y)
  (define label (list-ref row 3))
  (define num (string->number label))
  (define half (/ num 2))
  (list
   (hrule y (- half) half #:color neutral-color)
   (point-label (vector 0 y)
		(string-append "3:" label)
		#:anchor 'bottom #:point-size 5 #:size 9)))

  (define (positive-line row y)
    (let* ((4-label (list-ref row 4))
           (4-number (string->number 4-label))
           (5-label (list-ref row 5))
           (5-number (string->number 5-label))
           (4n5 (+ 4-number 5-number)))
      (list
       (lines (list(vector 0 y) (vector 4-number y)) #:color positive-color)
       (lines (list (vector 4-number y) (vector 4n5 y)) #:color positive-color #:width 3)
       (points (list (vector 4-number y)) #:color "black" #:sym 'fullcircle #:size 5)
       (point-label (vector 4n5 y) (string-append "4:" 4-label "," "5:" 5-label)
                   #:anchor 'bottom #:point-size 5))))

(define (negative-line row y)
  (let* ((1-label (list-ref row 1))
	 (1-number (string->number 1-label))
	 (2-label (list-ref row 2))
	 (2-number (string->number 2-label))
	 (1n2 (+ 1-number 2-number)))
    (list
     (point-label (vector (- 1n2) y) (string-append "1:" 1-label "," "2:" 2-label)
		  #:anchor 'bottom #:point-size 2)
     (lines (list (vector (- 1n2) y) (vector (- 2-number) y)) #:color negative-color #:width 3)
     (lines (list (vector (- 2-number) y) (vector 0 y)) #:color negative-color)
     (points (list (vector 0 y)) #:color "black" #:sym 'fullcircle #:size 5)
     )))

(define (place-question key dict Qx  y)
  (let* ((d-ref (dict-ref dict key))
	 (type (first d-ref))
	 (question (second d-ref))
	 (label (string-append type ":" question))
	 (y-offset .35)
	 (q-y (+ y y-offset)))positives-sum
	 (point-label (vector Qx  q-y) label #:size 14 #:point-size 0)))

(define (plot-a-question row dict Qx y)
  (list
   (neutral-line row (- y .3))
   (positive-line row (- y .05))
   (negative-line row (- y .05))
   (place-question (first row) dict Qx y)
   ))

(define (plot-questions data dict Qx)
  ;; need Qx to for place-question to work relative to plot x-min
  (define (recur rows y merged-plots)
    (cond
     ((empty? rows) merged-plots)
     (#t (recur (cdr rows) (add1 y)
		 (cons (plot-a-question (car rows) dict Qx y) merged-plots)))))
  (recur data 1 '()))

;;;; end of plot-one-body utilities
;; test: (minus-part-numbers-from-whole KI-data GK-data)

; make-single-plot-page-name info
(define (plot-a-body info data)
  (define plot-file-name
    (info-to-one-body-plot-file-name info))
  (define data-header-row (first data))
  (define data-strings (Qresults-to-ascending-order
			(cdr data)))

  (define sorted-labels
    (sort data-strings #:key positives-sum >))
  (define x-max (* 1.1
                  (positives-sum (car sorted-labels))))
  (define x-min (- (* 1.3 ;; few negative responses, need more space for labels
                     (negatives-sum
                      (car
                       (sort (cdr data-strings) #:key negatives-sum >))))))
  (define Q-txt-x (- (* 1.1 ; questions are long, start to left of 0
                     (negatives-sum
                      (car
                       (sort (cdr data-strings) #:key negatives-sum >))))))

  (parameterize
      ((plot-title (info-to-plot-title info))
       (plot-x-axis? #f)
       (plot-x-label #f)
       (plot-x-far-axis? #f)
       (plot-y-axis? #f)
       (plot-y-label #f)
       (plot-y-far-axis? #f)
       (plot-width 800)
       (plot-height 700)
       )
    (plot-file
     (plot-questions
      (sort data-strings #:key positives-sum >)
      Qs
      Q-txt-x)
     #:x-min x-min #:x-max x-max
     #:y-min .5 #:y-max  (+ .5 (length data-strings))
     (info-to-one-body-plot-file-name info)
     (img-type-prep plot-img-ext)
     )))

;;; end of plot-one-body
;; (plot-a-body KI-info KI-data)

;;;; start of synopic view plot utilites

(define (counts->percents number-list)
  (define sum (for/sum ((num number-list)) num))
  (for/list ((num number-list))
    (* (/ num sum) 100.0)))

(define (info-to-file-name info ext (add ""))
  (define suffix
    (if (< 0 (string-length add)) add ""))
  (file-add-extension
   (string-join (append (map second info)
			(list suffix))
		"-")
   ext))

(define point-with-label
  (lambda (x n l (algn 'bottom) (sze 8) (pnt-clr 0) (lbel-angl 0))
    (point-label (vector x n) l #:anchor algn #:size sze #:point-color pnt-clr #:angle lbel-angl)))

(define vertical-line-y1-to-y2
  (lambda (x y1 y2 (clr 0)) ; y1 and y2 are percents
    (list
     ;; line for responses of 2 and 4, one away from neutral
     (lines (map vector (list x x) (list 0 y1)) #:width 2 #:color clr)
     ;; line for responses of 1 and 5, farthest from neutral
     (lines (map vector (list x x) (list y1 y2)) #:width 5 #:color clr))))

(define (vertical-line-label x pcent4 pcent5 count4 count5 (lbl-aln 'bottom) (clr 0))
  ;;   x,y coordinates always given with same sign +pos or -neg
  ;; xlevel percents, 4's count 5's count
  ;; defaults to positive line with anchor 'bottom
  ;;  over-ride anchor with 'top for negative direction
    (let ((pcent4n5 (+ pcent4 pcent5))
	  (count-lbl (string-join (map number->string (list (abs count4) (abs count5))) ":")))
      (list
       (point-with-label x pcent4n5 (->plot-label count-lbl) lbl-aln)
       (vertical-line-y1-to-y2 x pcent4 pcent4n5 clr)))) ;; 1 is #:color 1 (red)
;; test: (vertical-line-label 3 30 40 3 4)
;; ;; (point-with-label 2 4 "2x4") (point-with-label  3 5 "3x5") (vertical-line-y1-to-y2 2 30 60)

(define (stack-one-side-results row (x 5.5) (lbl-aln 'bottom)(clr 0) (sign +))
  (let* ((count5 (first row))
	 (count4 (second row))
	 ;; (x 5.5) ;; #:x-max will be 5.8
	 (pcents (counts->percents row))
	 (pcent5 (first pcents))
	 (pcent4 (second pcents)))
    (vertical-line-label x (sign pcent4) (sign pcent5) (sign count4) (sign count5) lbl-aln clr)))
;; positive and negative sides
(define (stack-sides row x)
    (list
     (stack-one-side-results row x 'bottom 1)
     (stack-one-side-results (reverse row) x 'top 0 -)))
;; count-labels a 4c:5c at toep and 2c:1c at bottom
;; ; might be beter to go 5c:4c then 2c:1c like EP books

;; was: pos-neg-stacked-lines-labeled-rows3
(define (stack-sides-for-3rows row1 row2 row3 x)
  (list
   (stack-sides row1 (- x .30))
   (stack-sides row2 x)
   (stack-sides row3 (+ x .30))))

(define row-line-labels (list "教員" "学科" "大学"))
;; was label-rows3 in Plot-and-Page-Questionnaire-Results-from-Lr-Fd.rkt
(define (mark-xrange-with-dotted-lines x-mid (y-min 90) (y-max 99) (portion .95) (clr -2) (style 'dot))
  (define x-min (- x-mid (/ portion 2)))
  (define x-max (+ x-mid (/ portion 2)))
  (list
   (lines (list (vector x-min y-min) (vector x-min y-max)) #:color clr #:style style)
   (lines (list (vector x-max y-min) (vector x-max y-max)) #:color clr #:style style)))
(define (label-3-row-lines xmid (y-label-val 100 ) (y-dotline-min 90) (y-dotline-max 99) (labels row-line-labels))
  (list
   (point-label (vector (- xmid .30) y-label-val) (car labels) #:anchor 'bottom #:point-size 0)
   (point-label (vector xmid y-label-val) (cadr labels) #:anchor 'bottom #:point-size 0)
   (point-label (vector (+ xmid .30) y-label-val) (caddr labels) #:anchor 'bottom #:point-size 0)
   (mark-xrange-with-dotted-lines xmid y-dotline-min y-dotline-max)
   ))

;; At start, glabally define number-of-Qs from
;;  firs set of data-strings,
;;  error check that all data sets are same length?
;; make x-axes
(define (label-top-x-axis-with-Q-shorts Q-nums-shorts)
  (for/list ((num-short Q-nums-shorts))
    (point-label (vector (first num-short) 105)(second num-short)
		 #:anchor 'bottom #:size 12 #:point-color -1 #:point-size 0)))
(define (label-mark-bottom-x-axis Q-nums-shorts (y-axis-min -40))
  (define number-of-Qs (length Q-nums-shorts))
  (define line-xs (range .5 (add1 number-of-Qs) 1))
  (list ;; forget to list, and all plots skipped but for last list
   (for/list ((x line-xs))
     ;; TODO: figure out a way to define styles for range portion lines
     (lines (list (vector x y-axis-min)(vector x 0)) #:color -2 #:style 'dot))
   (for/list ((num-short Q-nums-shorts))
     (point-label (vector (first num-short) y-axis-min) (second num-short)
		  #:anchor 'bottom #:size 14 #:point-color -1 #:point-size 0))))

(define (data-strings-row-to-numbers row)
  (map string->number (cdr row)))
(define (stack-sides-interweave-3-data-sets d1 d2 d3)
    ;; data sets ;; number of rows = number of questions
  (define number-of-Qs (length d1))
  (for/list ((x number-of-Qs)) ; list-ref[erence] is 0-based
    (stack-sides-for-3rows
     (data-strings-row-to-numbers (list-ref d1 x))
     (data-strings-row-to-numbers (list-ref d2 x))
     (data-strings-row-to-numbers (list-ref d3 x))
     (add1 x)))) ; plot from 1 not 0
#racket-lang #data-visualization #facdev #fd #facultydevelopment #questionniares #racket-plot
Faculty Development classroom questionnaires: visualizing .csv data
DG.csv
体,年,期,員,枚
大学,2019,2,58,2049
設問,5,4,3,2,1
出席,1494,469,211,37,4
発言,396,534,926,197,162
取組,648,773,662,103,28
聞取,1277,579,285,62,11
資料,1123,636,366,68,18
時刻,1615,415,162,15,4
反応,1288,574,300,41,10
熱意,1512,469,210,15,6
理解,858,897,405,40,15
役立,1276,658,243,27,11
満足,1101,743,328,29,12
utils.rkt
#lang racket
;open file in DrRacket
(require csv-reading); for csv->list
(require plot)
(require plot/utils)
(require racket/dict)
(require racket/include)
(include "utils.rkt")

(match-define (list positive-color neutral-color negative-color)
  (list "red" "gray" "black"))

(define plot-img-ext "png")
(define page-ext "html")

(define Qs-file "SetsuMon.csv") ;; Qs-ja-file, Qs-en-file
(define Rs-file "KaiTou.csv") ;; Responses-ja.csv Response-en.csv

(define Qs (get-file-csv-data Qs-file))
;; 11 lists like this: '("出席" "学生取組" "私はこの授業によく出席した")
(define Rs (get-file-csv-data Rs-file))
;; 5 lists like this: '("5" "特に" "特にそう思う")
(define Qs-num-short (for/list ((Q Qs) ;; self-documenting?
				(N (in-naturals)))
		       (cons (add1 N) (list (car Q)))))

;; ;;
;; (define data-files '("KI.csv" "GK.csv" "DG.csv"))

(match-define (list KI-info KI-data)
  (csv-data-to-classdict-Qdata "KI.csv"))
;; test: KI-data
(match-define (list GK-info GK-data)
  (csv-data-to-classdict-Qdata "GK.csv"))
(match-define (list DG-info DG-data)
  (csv-data-to-classdict-Qdata "DG.csv"))
;; test expln: KI.csv with trailing commas DG-info without trailing ,
;; test: KI-info DG-info

(define (minus-part-numbers-from-whole part-data  whole-data)
  (for/list ((p-row part-data)
             (w-row whole-data))
    (map - (get-Qline-result-numbers w-row)
        (get-Qline-result-numbers p-row))))
;; test: (minus-part-numbers-from-whole KI-data GK-data)

(plot-a-body KI-info KI-data)
(plot-a-body GK-info GK-data)
(plot-a-body DG-info DG-data)
;;;;;;;;;;;;;;;;;;;;;;;;;;;;;;;;;;;;;; end one-body view

;;;;;;;;;;;;;;;;;;;;;;;;;;;;;;;;;;;;;; start synoptic view
;;; make 3body view, for one body previous semester,
;;; ;; previous year same semester, gradually generalize for
;;; ;; adjusting size according to number of comparisons

;; (info-to-file-name KI-info plot-img-ext "synoptic")
(match-define (list KI-results GK-results DG-results)
  (map cdr (list KI-data GK-data DG-data)))

;; (data-strings-row-to-numbers (second KI-data))
(parameterize
    ((plot-x-ticks (linear-ticks #:number 11))
     (plot-y-ticks (linear-ticks #:number 8))
     (plot-x-far-axis? #f)
     (plot-y-far-axis? #f))
  (plot
   (list
    (label-3-row-lines 2 85 55 110); Qnum label-y dot-low dot-high
    (map label-3-row-lines '(5 7 9 11)) ;; notate a few Q-lines
    (label-mark-bottom-x-axis Qs-num-short)
    (label-top-x-axis-with-Q-shorts Qs-num-short)
    (stack-sides-interweave-3-data-sets  KI-results GK-results DG-results)
    )
   #:x-label "設問 questions" #:y-label "割合 percent"
   #:x-min .3 #:x-max 11.7
   #:y-min -40 #:y-max 110
   #:width 1500 #:height 600
   #:title (info-to-plot-title DG-info)
   #:out-file (info-to-file-name DG-info plot-img-ext "synoptic")
   #:out-kind (img-type-prep plot-img-ext)
   ))
See Question Results in DrRacekt, as img files
(define (get-file-csv-data file-name)
  (define f-port (open-input-file file-name))
  (define data-lists (csv->list f-port))
  (close-input-port f-port)
  ;; close-* can't be last line or proc returns void
  data-lists)

(define (transpose-table lists)
  (define (recur ls merged)
    (cond
     ((empty? (car ls)) (reverse merged))
     (else (recur (map cdr ls)
		  (cons (map car ls) merged)))))
  (recur lists '()))

(define (remove-empty-cells dict)
  (filter (λ (cell) (< 0 (string-length (car cell))))
	  dict))
(define (csv-data-to-classdict-Qdata f-name)
  (define data-list (get-file-csv-data f-name))
  (define classdict (remove-empty-cells
		     (transpose-table
		      (take data-list 2))))
  (define Qdata (drop data-list 2))
  (list classdict  Qdata))
;; test: (define KId (csv-data-to-classdict-Qdata "KI.csv")) KId@


;; -data is all strings, good for labels in plot
;; ; but calculations need string->number conversions
(define (get-Qline-result-numbers Qline)
  (map string->number (cdr Qline)))
(define (get-Qdata-result-numbers data)
  ;; first data line is list of headers
  (define Q-results (cdr data))
    (for/list ((Qline Q-results))
      ;; first cell of each result list is short-name for Q
      ;; ; skip short name and string->number each frequency
      (get-Qline-result-numbers Qline)))
;; test: (get-numbers KI-data)

(define (info-to-plot-title dict)
  (string-join
   (for/list ((cell dict))
     (string-join cell ":"))
     ","))
;; test: (info-to-plot-title DG-info)

(define (info-to-page-title info (prefix ""))
  (if (< 0 (string-length prefix))
     (string-append prefix "-"
                   (string-join (map second
                                    (cdr info))))
     (string-join (map second info) "-")))
;; test: (info-to-page-title DG-info)
;; test: (info-to-page-title DG-info "共観")

(define (img-type-prep ext)
  (define sym
    (cond
     ((symbol? ext) ext)
     ((string? ext) (string->symbol
		     (regexp-replace #rx"^\\." ext "")))
     (else error "ext needs to be a string or a symbol")))
  sym)

(define (file-ext-string-check str)
  (if (regexp-match? #rx"^\\." str)
                  str
                  (string-append "." str)))
(define (file-ext-prep ext)
  (cond
    ((symbol? ext) (file-ext-string-check
                    (symbol->string ext)))
    ((string? ext) (file-ext-string-check
                    ext))
    (else (error "file extension must be a symbol or string"))))
;; test: (file-ext-prep plot-img-ext)
(define (file-add-extension fname ext)
  (string-append fname (file-ext-prep ext)))
;; test: (file-add-extension "file" plot-img-ext)
;; > (file-add-extension "file" 'svg) "file.svg"
;; > (file-add-extension "file" "png") "file.png"
;; > (file-add-extension "file" ".png")

(define (info-to-one-body-plot-file-name dict (ext plot-img-ext))
  (file-add-extension
   (string-join (map second dict) "-") ext))
;; test: (info-to-one-body-plot-file-name DG-info)

(define (Qresults-to-ascending-order Qresults)
  ;; header row removed from data for Qresults arg
  (map (λ (row) (cons (car row) (reverse (cdr row))))
       Qresults))

(define (get-result-number row n)
  (string->number (list-ref row n)))

;; later (sum-results row list-of-numbers...
(define (sum-2-results row n m)
  (+ (get-result-number row n) (get-result-number row m)))

;; depends on ascending order or results after Q-short-name
(define (positives-sum row)
  (sum-2-results row 4 5))
(define (negatives-sum row)
  (sum-2-results row 1 2))

(define (get-neutral-response-num row)
  (list-ref row 3))

(define (neutral-line row y)
  (define label (list-ref row 3))
  (define num (string->number label))
  (define half (/ num 2))
  (list
   (hrule y (- half) half #:color neutral-color)
   (point-label (vector 0 y)
		(string-append "3:" label)
		#:anchor 'bottom #:point-size 5 #:size 9)))

  (define (positive-line row y)
    (let* ((4-label (list-ref row 4))
           (4-number (string->number 4-label))
           (5-label (list-ref row 5))
           (5-number (string->number 5-label))
           (4n5 (+ 4-number 5-number)))
      (list
       (lines (list(vector 0 y) (vector 4-number y)) #:color positive-color)
       (lines (list (vector 4-number y) (vector 4n5 y)) #:color positive-color #:width 3)
       (points (list (vector 4-number y)) #:color "black" #:sym 'fullcircle #:size 5)
       (point-label (vector 4n5 y) (string-append "4:" 4-label "," "5:" 5-label)
                   #:anchor 'bottom #:point-size 5))))

(define (negative-line row y)
  (let* ((1-label (list-ref row 1))
	 (1-number (string->number 1-label))
	 (2-label (list-ref row 2))
	 (2-number (string->number 2-label))
	 (1n2 (+ 1-number 2-number)))
    (list
     (point-label (vector (- 1n2) y) (string-append "1:" 1-label "," "2:" 2-label)
		  #:anchor 'bottom #:point-size 2)
     (lines (list (vector (- 1n2) y) (vector (- 2-number) y)) #:color negative-color #:width 3)
     (lines (list (vector (- 2-number) y) (vector 0 y)) #:color negative-color)
     (points (list (vector 0 y)) #:color "black" #:sym 'fullcircle #:size 5)
     )))

(define (place-question key dict Qx  y)
  (let* ((d-ref (dict-ref dict key))
	 (type (first d-ref))
	 (question (second d-ref))
	 (label (string-append type ":" question))
	 (y-offset .35)
	 (q-y (+ y y-offset)))positives-sum
	 (point-label (vector Qx  q-y) label #:size 14 #:point-size 0)))

(define (plot-a-question row dict Qx y)
  (list
   (neutral-line row (- y .3))
   (positive-line row (- y .05))
   (negative-line row (- y .05))
   (place-question (first row) dict Qx y)
   ))

(define (plot-questions data dict Qx)
  ;; need Qx to for place-question to work relative to plot x-min
  (define (recur rows y merged-plots)
    (cond
     ((empty? rows) merged-plots)
     (#t (recur (cdr rows) (add1 y)
		 (cons (plot-a-question (car rows) dict Qx y) merged-plots)))))
  (recur data 1 '()))

;;;; end of plot-one-body utilities
;; test: (minus-part-numbers-from-whole KI-data GK-data)

; make-single-plot-page-name info
(define (plot-a-body info data)
  (define plot-file-name
    (info-to-one-body-plot-file-name info))
  (define data-header-row (first data))
  (define data-strings (Qresults-to-ascending-order
			(cdr data)))

  (define sorted-labels
    (sort data-strings #:key positives-sum >))
  (define x-max (* 1.1
                  (positives-sum (car sorted-labels))))
  (define x-min (- (* 1.3 ;; few negative responses, need more space for labels
                     (negatives-sum
                      (car
                       (sort (cdr data-strings) #:key negatives-sum >))))))
  (define Q-txt-x (- (* 1.1 ; questions are long, start to left of 0
                     (negatives-sum
                      (car
                       (sort (cdr data-strings) #:key negatives-sum >))))))

  (parameterize
      ((plot-title (info-to-plot-title info))
       (plot-x-axis? #f)
       (plot-x-label #f)
       (plot-x-far-axis? #f)
       (plot-y-axis? #f)
       (plot-y-label #f)
       (plot-y-far-axis? #f)
       (plot-width 800)
       (plot-height 700)
       )
    (plot-file
     (plot-questions
      (sort data-strings #:key positives-sum >)
      Qs
      Q-txt-x)
     #:x-min x-min #:x-max x-max
     #:y-min .5 #:y-max  (+ .5 (length data-strings))
     (info-to-one-body-plot-file-name info)
     (img-type-prep plot-img-ext)
     )))

;;; end of plot-one-body
;; (plot-a-body KI-info KI-data)

;;;; start of synopic view plot utilites

(define (counts->percents number-list)
  (define sum (for/sum ((num number-list)) num))
  (for/list ((num number-list))
    (* (/ num sum) 100.0)))

(define (info-to-file-name info ext (add ""))
  (define suffix
    (if (< 0 (string-length add)) add ""))
  (file-add-extension
   (string-join (append (map second info)
			(list suffix))
		"-")
   ext))

(define point-with-label
  (lambda (x n l (algn 'bottom) (sze 8) (pnt-clr 0) (lbel-angl 0))
    (point-label (vector x n) l #:anchor algn #:size sze #:point-color pnt-clr #:angle lbel-angl)))

(define vertical-line-y1-to-y2
  (lambda (x y1 y2 (clr 0)) ; y1 and y2 are percents
    (list
     ;; line for responses of 2 and 4, one away from neutral
     (lines (map vector (list x x) (list 0 y1)) #:width 2 #:color clr)
     ;; line for responses of 1 and 5, farthest from neutral
     (lines (map vector (list x x) (list y1 y2)) #:width 5 #:color clr))))

(define (vertical-line-label x pcent4 pcent5 count4 count5 (lbl-aln 'bottom) (clr 0))
  ;;   x,y coordinates always given with same sign +pos or -neg
  ;; xlevel percents, 4's count 5's count
  ;; defaults to positive line with anchor 'bottom
  ;;  over-ride anchor with 'top for negative direction
    (let ((pcent4n5 (+ pcent4 pcent5))
	  (count-lbl (string-join (map number->string (list (abs count4) (abs count5))) ":")))
      (list
       (point-with-label x pcent4n5 (->plot-label count-lbl) lbl-aln)
       (vertical-line-y1-to-y2 x pcent4 pcent4n5 clr)))) ;; 1 is #:color 1 (red)
;; test: (vertical-line-label 3 30 40 3 4)
;; ;; (point-with-label 2 4 "2x4") (point-with-label  3 5 "3x5") (vertical-line-y1-to-y2 2 30 60)

(define (stack-one-side-results row (x 5.5) (lbl-aln 'bottom)(clr 0) (sign +))
  (let* ((count5 (first row))
	 (count4 (second row))
	 ;; (x 5.5) ;; #:x-max will be 5.8
	 (pcents (counts->percents row))
	 (pcent5 (first pcents))
	 (pcent4 (second pcents)))
    (vertical-line-label x (sign pcent4) (sign pcent5) (sign count4) (sign count5) lbl-aln clr)))
;; positive and negative sides
(define (stack-sides row x)
    (list
     (stack-one-side-results row x 'bottom 1)
     (stack-one-side-results (reverse row) x 'top 0 -)))
;; count-labels a 4c:5c at toep and 2c:1c at bottom
;; ; might be beter to go 5c:4c then 2c:1c like EP books

;; was: pos-neg-stacked-lines-labeled-rows3
(define (stack-sides-for-3rows row1 row2 row3 x)
  (list
   (stack-sides row1 (- x .30))
   (stack-sides row2 x)
   (stack-sides row3 (+ x .30))))

(define row-line-labels (list "教員" "学科" "大学"))
;; was label-rows3 in Plot-and-Page-Questionnaire-Results-from-Lr-Fd.rkt
(define (mark-xrange-with-dotted-lines x-mid (y-min 90) (y-max 99) (portion .95) (clr -2) (style 'dot))
  (define x-min (- x-mid (/ portion 2)))
  (define x-max (+ x-mid (/ portion 2)))
  (list
   (lines (list (vector x-min y-min) (vector x-min y-max)) #:color clr #:style style)
   (lines (list (vector x-max y-min) (vector x-max y-max)) #:color clr #:style style)))
(define (label-3-row-lines xmid (y-label-val 100 ) (y-dotline-min 90) (y-dotline-max 99) (labels row-line-labels))
  (list
   (point-label (vector (- xmid .30) y-label-val) (car labels) #:anchor 'bottom #:point-size 0)
   (point-label (vector xmid y-label-val) (cadr labels) #:anchor 'bottom #:point-size 0)
   (point-label (vector (+ xmid .30) y-label-val) (caddr labels) #:anchor 'bottom #:point-size 0)
   (mark-xrange-with-dotted-lines xmid y-dotline-min y-dotline-max)
   ))

;; At start, glabally define number-of-Qs from
;;  firs set of data-strings,
;;  error check that all data sets are same length?
;; make x-axes
(define (label-top-x-axis-with-Q-shorts Q-nums-shorts)
  (for/list ((num-short Q-nums-shorts))
    (point-label (vector (first num-short) 105)(second num-short)
		 #:anchor 'bottom #:size 12 #:point-color -1 #:point-size 0)))
(define (label-mark-bottom-x-axis Q-nums-shorts (y-axis-min -40))
  (define number-of-Qs (length Q-nums-shorts))
  (define line-xs (range .5 (add1 number-of-Qs) 1))
  (list ;; forget to list, and all plots skipped but for last list
   (for/list ((x line-xs))
     ;; TODO: figure out a way to define styles for range portion lines
     (lines (list (vector x y-axis-min)(vector x 0)) #:color -2 #:style 'dot))
   (for/list ((num-short Q-nums-shorts))
     (point-label (vector (first num-short) y-axis-min) (second num-short)
		  #:anchor 'bottom #:size 14 #:point-color -1 #:point-size 0))))

(define (data-strings-row-to-numbers row)
  (map string->number (cdr row)))
(define (stack-sides-interweave-3-data-sets d1 d2 d3)
    ;; data sets ;; number of rows = number of questions
  (define number-of-Qs (length d1))
  (for/list ((x number-of-Qs)) ; list-ref[erence] is 0-based
    (stack-sides-for-3rows
     (data-strings-row-to-numbers (list-ref d1 x))
     (data-strings-row-to-numbers (list-ref d2 x))
     (data-strings-row-to-numbers (list-ref d3 x))
     (add1 x)))) ; plot from 1 not 0
#racket-lang #data-visualization #facdev #fd #facultydevelopment #questionniares #racket-plot